
Content with notebookss
You can also create content with Jupyter Notebooks. The content for the current page is contained
in a Jupyter Notebook in the notebooks/ folder of the repository. This means that we can include
code blocks and their outputs, and export them to Jekyll markdown.d
You can find the original notebook for this page at this address
Markdown + notebooks
As it is markdown, you can embed images, HTML, etc into your posts!

You an also $add_{math}$ and
$$ math^{blocks} $$or
$$ \begin{align*} \mbox{mean} la_{tex} \\ \\ math blocks \end{align*} $$But make sure you \$Escape \$your \$dollar signs \$you want to keep!
Code blocks and image outputs
Textbooks with Jupyter will also embed your code blocks and output in your site. For example, here's some sample Matplotlib code:
from matplotlib import rcParams, cycler
import matplotlib.pyplot as plt
import numpy as np
plt.ion()
# Fixing random state for reproducibility
np.random.seed(19680801)

N = 10
data = [np.logspace(0, 1, 100) + np.random.randn(100) + ii for ii in range(N)]
data = np.array(data).T
cmap = plt.cm.coolwarm
rcParams['axes.prop_cycle'] = cycler(color=cmap(np.linspace(0, 1, N)))


from matplotlib.lines import Line2D
custom_lines = [Line2D([0], [0], color=cmap(0.), lw=4),
                Line2D([0], [0], color=cmap(.5), lw=4),
                Line2D([0], [0], color=cmap(1.), lw=4)]

fig, ax = plt.subplots(figsize=(10, 5))
lines = ax.plot(data)
ax.legend(custom_lines, ['Cold', 'Medium', 'Hot']);
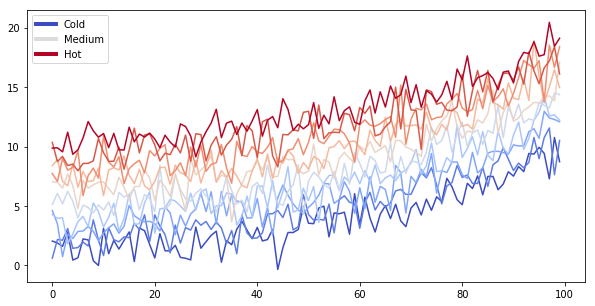
Note that the image above is captured and displayed by Jekyll.
Removing content before publishing
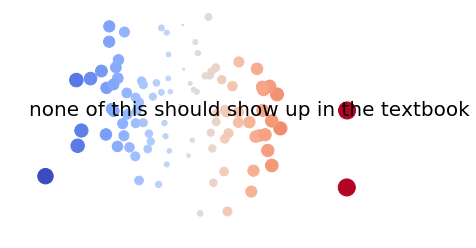
You can also remove some content before publishing your book to the web. For example, in the original notebook there used to be a cell below...
thisvariable = "none of this should show up in the textbook"

fig, ax = plt.subplots()
x = np.random.randn(100)
y = np.random.randn(100)
ax.scatter(x, y, s=np.abs(x*100), c=x, cmap=plt.cm.coolwarm)
ax.text(0, .5, thisvariable, fontsize=20, transform=ax.transAxes)
ax.set_axis_off()
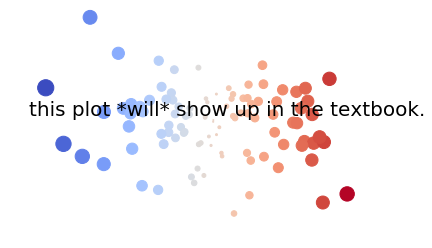
You can also remove only the code so that images and other output still show up.
Below we'll only display an image. It was generated with Python code in a cell, which you can see in the original notebook
# NO CODE
thisvariable = "this plot *will* show up in the textbook."

fig, ax = plt.subplots()
x = np.random.randn(100)
y = np.random.randn(100)
ax.scatter(x, y, s=np.abs(x*100), c=x, cmap=plt.cm.coolwarm)
ax.text(0, .5, thisvariable, fontsize=20, transform=ax.transAxes)
ax.set_axis_off()
And here we'll only display a Pandas DataFrame. Again, this was generated with Python code from this original notebook.
# NO CODE
import pandas as pd
pd.DataFrame([['hi', 'there'], ['this', 'is'], ['a', 'DataFrame']], columns=['Word A', 'Word B'])
You can configure the text that Textbooks with Jupyter uses for this by modifying your book's _config.yml file.
Interactive outputs
We can even do the same for interactive material. Below we'll display a map using ipyleaflet. When the notebook
is converted to Markdown, the code for creating the interactive map is retained.
Note that this will only work for some packages. They need to be able to output standalone HTML/Javascript, and not depend on an underlying Python kernel to work.
import folium
m = folium.Map(
    location=[45.372, -121.6972],
    zoom_start=12,
    tiles='Stamen Terrain'
)

folium.Marker(
    location=[45.3288, -121.6625],
    popup='Mt. Hood Meadows',
    icon=folium.Icon(icon='cloud')
).add_to(m)

folium.Marker(
    location=[45.3311, -121.7113],
    popup='Timberline Lodge',
    icon=folium.Icon(color='green')
).add_to(m)

folium.Marker(
    location=[45.3300, -121.6823],
    popup='Some Other Location',
    icon=folium.Icon(color='red', icon='info-sign')
).add_to(m)


m